Our Monitoring
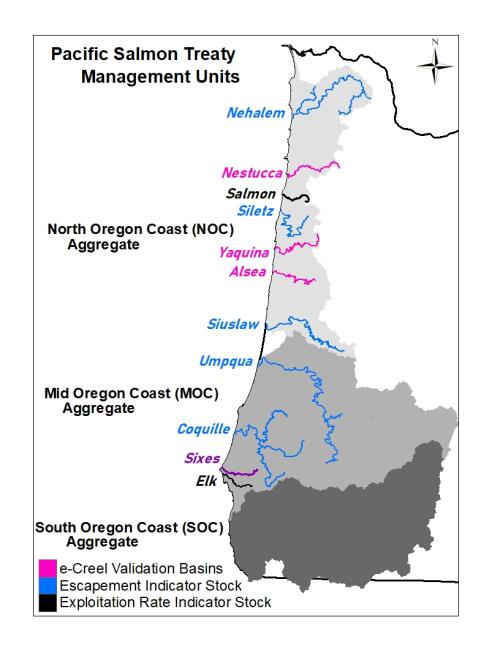
CCRMP conducts monitoring studies along the Oregon Coast to help fulfill Oregon’s commitment to the Pacific Salmon Treaty and to provide pertinent information to ODFW. For PST monitoring purposes, the Oregon Coast is divided up into three aggregate units. CCRMP conducts surveys in two of these, the North Oregon Coast (NOC) and Mid Oregon Coast (MOC). There are several highly productive rivers in these regions, and so to refine our monitoring efforts, we use a few rivers as indicators for the whole aggregate population of a unit. These are separated out into two types of stocks: Escapement Indicator Stocks (EIS) and Exploitation Rate Indicator Stocks (ERIS). Escapement Indicator Stocks (EIS) tell us how much of the population makes it back up to the spawning grounds (salmon that “escape” fisheries to return to spawn). Exploitation Rate Indicator Stocks (ERIS) contain hatcheries which produce known quantities of Coded Wire Tag fish and therefore can tell us how much of the population is harvested (exploited) in the ocean. Our EIS basins for the North Coast include the Nehalem, Siletz, and Siuslaw rivers; while for the MOC we monitor the Umpqua and Coquille rivers. For our ERIS basins, we monitor the Salmon River in the NOC and the Elk River in the MOC.
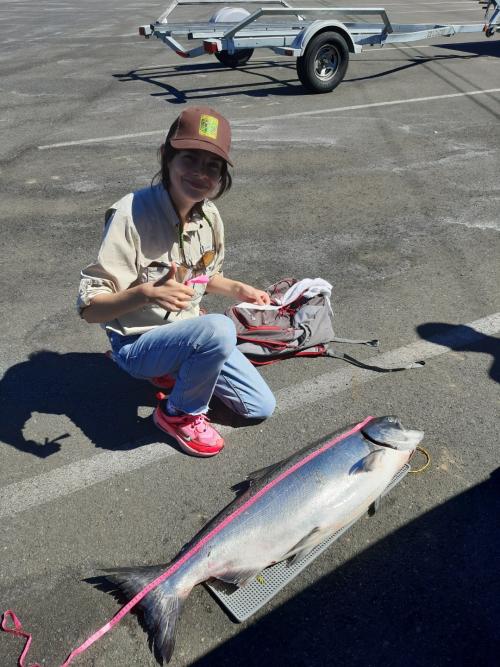
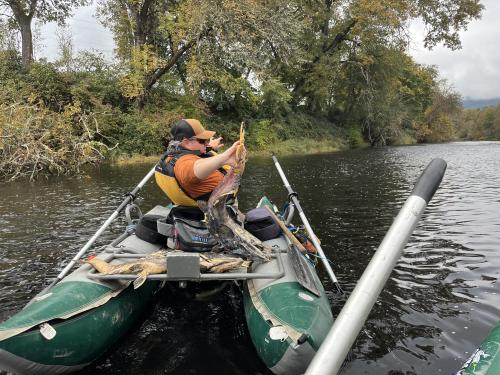
To help us meet our commitment to the PST and to provide information to fisheries managers at ODFW, we primarily conduct two different kinds of monitoring surveys. The first is our creel surveys, in which we interview anglers fishing in coastal rivers to determine salmon harvest. CCRMP also monitors numbers of released fish and distinguishes harvest of salmon by origin (hatchery versus wild) and age. The second part is spawning ground surveys (SGS) where we hike or float through salmon spawning habitat and count redds, live fish, and carcasses for coastal salmon (Chinook Salmon, Coho Salmon, and occasionally Chum Salmon, Pink Salmon, and Steelhead Salmon). CCRMP and the Oregon Adult Salmonid Inventory and Sampling Project's SGS data is available here.
Both parts of our monitoring teams also collect biological data including length, sex, and scale samples from harvested or spawned out fish which allows us to develop an age structure for the runs (more below).
Our ERIS basins are also monitored via coded wire tags (CWT). These are small metal tags implanted into young fish; each tag has a code printed on it that tells us which basin and year the fish originated from. CWTs are collected from fish harvested in the ocean, harvested in the river, or carcasses post-spawning, enabling us to learn about run age structures and exploitation rates. See our research page for more information about CWT projects.
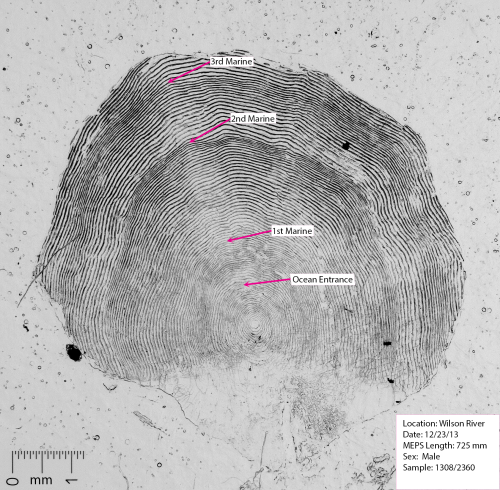
We collect scale samples from the majority of Chinook Salmon we encounter, whether harvested or recovered from the spawning grounds. Salmon scales exhibit growth rings, rather like a tree. We can determine the age of a fish through examination of the scales under a microscope. This allows us to reconstruct the age structure of the run, a powerful tool that helps us monitor the overall well-being of these populations. At the end of each season, CCRMP sends our scale collections to the Fish Life History Analysis Program (FLHAP) for reading.